Reverse Debugging and other stories

Debugging can be very hard
A bug is an undesired state that makes our system behave in a wrong manner.
The symptom can be a crash, a wrong result, an unintended operation, etc. In most cases, the bugs are discovered based on symptoms. However, to solve them we have to find the root cause that leads to the observed wrong behaviors. The causes consist of bad design, unexpected input, wrong system configuration, etc. The cause and the symptom (effect) of a bug are chained together through a set of function calls and instructions, which in some cases can be very long. The process through which we construct the path between the two is named debugging.
Hard to debug scenario
Now, let’s imagine that we have a server-side application that receives requests from a client to access some resources. Our application must parse each network packet, extract the path to the resource, access the resource, and send the result back to the client. Although, our service has a little hidden bug that crashes the system if the received packets are not properly formatted. The chances to receive a malformed packet are very low and the application crashed 2 times this month. What procedure are we going to follow to solve this issue?
Usual debugging flow
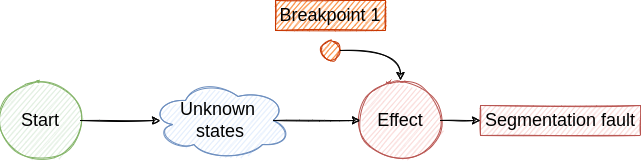
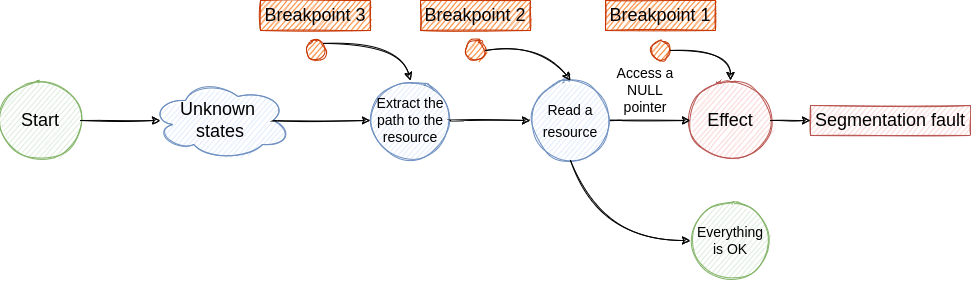
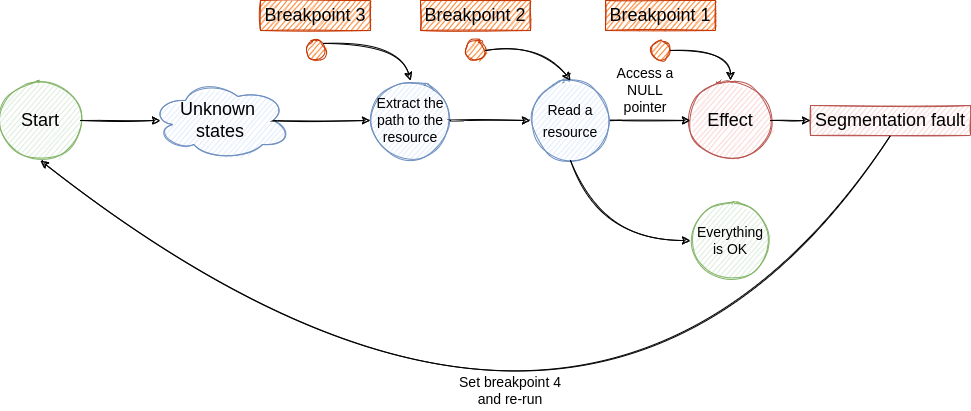
No matter what bug we try to fix, we start from its effect and we try to find all the previous states that drove the execution to the observed effect. When we find the first state, from the execution timeline perspective, we reach the cause and we can apply the fix.
By using traditional debugging techniques we create an investigation loop that consists of the following steps:
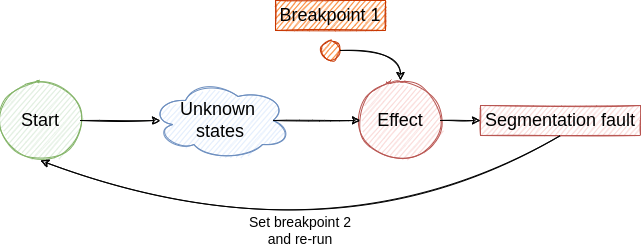
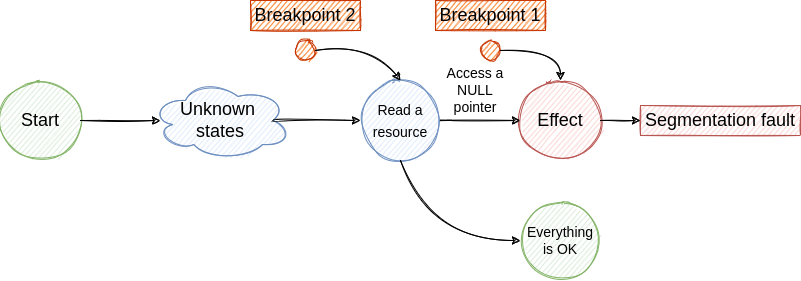
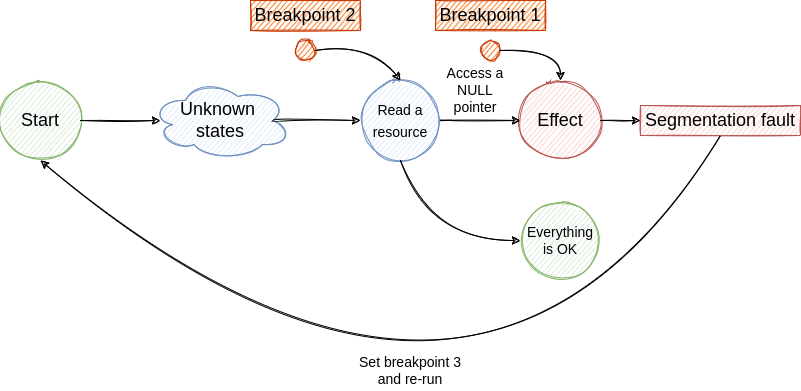
- Place a breakpoint where the effect was observed ->
Segmentation fault. Core dumped - Run the program. Eventually, the execution stops at the breakpoint. Here we dump some variables, check the backtrace, inspect some pointers and make the assumption that the failure was generated by a previous state ->
Access a NULL pointer - To investigate the next step we have to travel back in time, but this is not possible with traditional debuggers. So, we have to restart the program and place a new breakpoint to identify the cause of the NULL pointer access.
- If we are lucky we hit the breakpoint and we find the cause for NULL pointer access. From this state, we jump to step 2 and continue the investigation until we find the root cause. Although, if the root cause is generated by a non-deterministic factor the bug fixing process will be very hard and will require multiple re-runs.
The described loop is illustrated in the following figures.
Example application
These kinds of bugs can benefit from another debugging approach that I will present later, but first, let’s grab a practical example to make the understanding easier.
#include <stdio.h>
#include <time.h>
#include <stdlib.h>
#include <signal.h>

typedef struct {
    int id;
    int random;
} tuple_t;

tuple_t v[10];

void generate() {
    srand(time(NULL));
    for (int i = 0; i < 10; i++) {
        v[i].id = i;
        v[i].random = rand() % 30;
        printf("id: %d - random: %d\n", v[i].id, v[i].random);
        if (13 == v[i].random) {
            raise(SIGSEGV);
        }
    }
}

int main() {
    generate();

    return 0;
}
This simple application fills the fields of tuple_t structure with random numbers. However, the application crashes and generates a segmentation fault, if the generated number is 13.
Now our job is to find the cause of the crash. In this case, it’s very easy to identify it, but again, let’s simplify things for the sake of understanding. Let’s suppose that if (13 == v[i].random) is a more complex cause and is hidden between thousands of lines of code. By using the traditional debugging method described above we have to insert multiple breakpoints to find the cause of the crash. Moreover, there is a randomness factor in the example application which implies that the application will not crash every time it runs. This makes the debugging process much harder. Fortunately, there is another type of debuggers that can help us with this kind of issue.
What if we could travel in time
Reverse debugging approach
Most debuggers act in a linear manner. The program is launched into execution using the debugger, some breakpoints are set and the execution continues. Eventually, the execution will be stopped at the breakpoints set before. When it comes to bug hunting, this approach can be ineffective. As we’ve seen in the standard debugging flow example, if the issue is hard to reproduce and is dependent on external, non-deterministic factors, we are going to spend a lot of time setting breakpoints and resuming the execution. This is a time-consuming process.
Reverse debuggers
To overcome this issue, reverse debuggers came into play. Their most powerful feature is to stop the program after a failure and step back in the history of execution to reveal all the states that led to the failure. This action is performed without restarting the program which ensures that the same non-deterministic factors are used. Does it sound awesome? There are more coming, so let’s start.
The most important features of reverse debuggers are recording, rewinding, and replaying. We can record the execution of the program which means that all non-deterministic factors are saved by the debugger. Among these are file reading, incoming network packets, signals, etc., basically, every input given to our program that is not 100% reproducible between different runs. By rewinding we are able the step back in the execution history, it's like time traveling. In this way, we can discover the previous state that led to the current one. Also, another useful example is the ability to find the point in time that changed a variable's value. By replaying we can re-run the same program using the same non-deterministic factors as many times as we want. Moreover, we can share the recorded version with other developers and their replay process will be identical to ours.
All of these features allow us to debug more effectively and intentionally. We are not stuck in repetitive and useless re-runs that miss the system's failure due to the hard reproducibility of a bug. Moreover, we are able to automate this task by scripting the recording phase and keeping only the recording that contains the failure.
Available reverse debuggers on the market
There are many languages that have reverse debuggers nowadays. Here is a short list:
Because most of the time I use C/C++ I looked in more detail at the reverse debuggers that can help me in my daily job. Here we have:
- For Linux:
- For Windows:
Next, I will focus on rr because I work mainly on Linux, UDB is paid and with gdb is more complicated to achieve our goal.
rr hands-on
Now let’s explore each major feature of a reverse debugger using rr, but first, build the sample application.
gcc -g main.c -o sample_app
Recording
The execution of an application is affected by two kinds of factors: deterministic and non-deterministic factors. The former are events and data that don’t change between executions. The latter can vary between different runs and are the most important in debugging because they can change the flow of our program and affect bug reproducibility. A reverse debugger is able to record all the non-deterministic factors which means that every time we replay the application we will use the same buffers, network packets, I/O events, etc. This means that once we recorded a crashing application we have a complete snapshot of that execution with all factors that crashed it. In other words, every time when we replay the recording, the bug will be there and will happen.
Let’s see it in work. First of all we need to set kernel.perf_event_paranoid to 1 to allow rr to monitor the CPU events.
sudo sysctl kernel.perf_event_paranoid=1
To record the sample_app run:
rr record sample_app
Output:
rr: Saving execution to trace directory `/home/user/.local/share/rr/sample_app-3'.
id: 0 - random: 15
id: 1 - random: 20
id: 2 - random: 8
id: 3 - random: 27
id: 4 - random: 1
id: 5 - random: 2
id: 6 - random: 17
id: 7 - random: 25
id: 8 - random: 2
id: 9 - random: 22
😱 we don’t have a crash. Yep, the bug is hard to reproduce, it is random. Try it again.
rr record sample_app
…..
Five tries later:
rr: Saving execution to trace directory `/home/user/.local/share/rr/sample_app-8'.
id: 0 - random: 10
id: 1 - random: 10
id: 2 - random: 9
id: 3 - random: 13
[1]    673068 segmentation fault  rr record sample_app
Here we are. /home/user/.local/share/rr/sample_app-8 is the recording that contains the crash in all its glory.
Replaying
This is the reverse debugger’s ability to re-run the recorded program using the same non-deterministic factors, even if they are random. In our case, this means that the bug will happen each time the recording is replayed and we are going to see the same random numbers. Cool.
rr replay /home/user/.local/share/rr/sample_app-8
(rr) c
Continuing.
id: 0 - random: 10
id: 1 - random: 10
id: 2 - random: 9
id: 3 - random: 13

Program received signal SIGSEGV, Segmentation fault.
Rewinding
Yet another awesome feature that allows us to travel back in time. This means that we can step back in the execution history, place a breakpoint in the past, discover the previous state that led to the current one, find the point in time that changed a variable's value, and more.
rr replay /home/user/.local/share/rr/sample_app-8
(rr) break 20 # set a break point at line 20: raise(SIGSEGV);
Breakpoint 1 at 0x55ab2306d2a6: file main.c, line 20.
(rr) c # continue the execution
Continuing.
id: 0 - random: 10
id: 1 - random: 10
id: 2 - random: 9
id: 3 - random: 13

Breakpoint 1, generate () at main.c:20
20	            raise(SIGSEGV);
(rr) print v[i].random
$1 = 13
(rr) break 18 # printf("id: %d - random: %d\n", v[i].id, v[i].random);
Breakpoint 2 at 0x55ab2306d249: file main.c, line 18.
(rr) reverse-continue
Continuing.

Breakpoint 2, generate () at main.c:18
18	        printf("id: %d - random: %d\n", v[i].id, v[i].random);
(rr) print v[i].random
$2 = 13
(rr) reverse-continue
Continuing.

Breakpoint 2, generate () at main.c:18
18	        printf("id: %d - random: %d\n", v[i].id, v[i].random);
(rr) print v[i].random
$3 = 9
(rr) reverse-continue
Continuing.

Breakpoint 2, generate () at main.c:18
18	        printf("id: %d - random: %d\n", v[i].id, v[i].random);
(rr) print v[i].random
$4 = 10
(rr) reverse-continue
Continuing.

Breakpoint 2, generate () at main.c:18
18	        printf("id: %d - random: %d\n", v[i].id, v[i].random);
(rr) print v[i].random
$5 = 10
In the above example, we step back through the program execution and we printed the random numbers in the reverse order. I hope this illustrates the travel-back-in-time capability of rr. More useful debugging tips follow 🍿.
Story 1: What if we could let the bug happen and drink a coffee (or more)?
I’ve mentioned before that one big plus of the reverse debuggers is their ability to record and reply a crashing application. However, there are bugs that manifest very rarely and require many runs for capturing, as we observed above in the case of our sample application. The repetitive run can be a time-consuming and frustrating process, especially when you don’t know the factor that causes the crash. It can be a specific network flow, a certain reading from the disk, a combination of both or other factors. Fortunately, we can automatize the process that records the execution of the application. Here is an example.
#!/bin/sh

RECORD_PATH="/home/user/.local/share/rr/sample_app-*"

rr record sample_app

while [ $? -eq 0 ];
do
    echo "No bugs here!"
    echo "Delete the rr recording"
    # delete the rr recording; we don't need it if no seg fault was reported
    rm -rf $RECORD_PATH
    sleep 1
    rr record a.out
done

echo "We have a bug!"
The script records the execution of sample_app using rr and checks its return code. If it’s 0 it means that the application didn’t crash so we can delete the recording. After that, we sleep for 1 second (this sleep was introduced to increase the entropy for the random number generator) and record the execution again. This loop continues until we detect a crash. Let’s give it a try.
./run_in_loop.sh
rr: Saving execution to trace directory `/home/user/.local/share/rr/sample_app-1'.
id: 0 - random: 8
id: 1 - random: 7
id: 2 - random: 7
id: 3 - random: 17
id: 4 - random: 29
id: 5 - random: 18
id: 6 - random: 1
id: 7 - random: 21
id: 8 - random: 21
id: 9 - random: 18
No bugs here!
Delete the rr recording
rr: Saving execution to trace directory `/home/user/.local/share/rr/sample_app-0'.
id: 0 - random: 3
id: 1 - random: 14
id: 2 - random: 8
id: 3 - random: 12
id: 4 - random: 7
id: 5 - random: 2
id: 6 - random: 26
id: 7 - random: 2
id: 8 - random: 2
id: 9 - random: 18
No bugs here!
Delete the rr recording
rr: Saving execution to trace directory `/home/user/.local/share/rr/sample_app-0'.
id: 0 - random: 8
id: 1 - random: 3
id: 2 - random: 22
id: 3 - random: 1
id: 4 - random: 17
id: 5 - random: 21
id: 6 - random: 24
id: 7 - random: 29
id: 8 - random: 21
id: 9 - random: 20
No bugs here!
Delete the rr recording
rr: Saving execution to trace directory `/home/user/.local/share/rr/sample_app-0'.
id: 0 - random: 22
id: 1 - random: 21
id: 2 - random: 4
id: 3 - random: 23
id: 4 - random: 19
id: 5 - random: 20
id: 6 - random: 25
id: 7 - random: 20
id: 8 - random: 27
id: 9 - random: 0
No bugs here!
Delete the rr recording
rr: Saving execution to trace directory `/home/user/.local/share/rr/sample_app-0'.
id: 0 - random: 19
id: 1 - random: 23
id: 2 - random: 27
id: 3 - random: 0
id: 4 - random: 29
id: 5 - random: 6
id: 6 - random: 18
id: 7 - random: 2
id: 8 - random: 26
id: 9 - random: 19
No bugs here!
Delete the rr recording
rr: Saving execution to trace directory `/home/user/.local/share/rr/sample_app-0'.
id: 0 - random: 11
id: 1 - random: 17
id: 2 - random: 24
id: 3 - random: 9
id: 4 - random: 0
id: 5 - random: 17
id: 6 - random: 22
id: 7 - random: 20
id: 8 - random: 9
id: 9 - random: 4
No bugs here!
Delete the rr recording
rr: Saving execution to trace directory `/home/user/.local/share/rr/sample_app-0'.
id: 0 - random: 17
id: 1 - random: 10
id: 2 - random: 16
id: 3 - random: 23
id: 4 - random: 22
id: 5 - random: 15
id: 6 - random: 3
id: 7 - random: 16
id: 8 - random: 9
id: 9 - random: 12
No bugs here!
Delete the rr recording
rr: Saving execution to trace directory `/home/user/.local/share/rr/sample_app-0'.
id: 0 - random: 21
id: 1 - random: 1
id: 2 - random: 23
id: 3 - random: 10
id: 4 - random: 14
id: 5 - random: 0
id: 6 - random: 18
id: 7 - random: 27
id: 8 - random: 12
id: 9 - random: 17
No bugs here!
Delete the rr recording
rr: Saving execution to trace directory `/home/user/.local/share/rr/sample_app-0'.
id: 0 - random: 23
id: 1 - random: 7
id: 2 - random: 24
id: 3 - random: 23
id: 4 - random: 22
id: 5 - random: 7
id: 6 - random: 17
id: 7 - random: 7
id: 8 - random: 5
id: 9 - random: 21
No bugs here!
Delete the rr recording
rr: Saving execution to trace directory `/home/user/.local/share/rr/sample_app-0'.
id: 0 - random: 24
id: 1 - random: 7
id: 2 - random: 28
id: 3 - random: 9
id: 4 - random: 20
id: 5 - random: 24
id: 6 - random: 10
id: 7 - random: 6
id: 8 - random: 0
id: 9 - random: 2
No bugs here!
Delete the rr recording
rr: Saving execution to trace directory `/home/user/.local/share/rr/sample_app-0'.
id: 0 - random: 22
id: 1 - random: 10
id: 2 - random: 2
id: 3 - random: 22
id: 4 - random: 2
id: 5 - random: 27
id: 6 - random: 19
id: 7 - random: 20
id: 8 - random: 27
id: 9 - random: 12
No bugs here!
Delete the rr recording
rr: Saving execution to trace directory `/home/user/.local/share/rr/sample_app-0'.
id: 0 - random: 5
id: 1 - random: 13
Segmentation fault
We have a bug!
So, we needed 12 runs to catch the crash, but everything run automatically. This can be a huge improvement on large projects and very hard to replicate crashes. Moreover, this kind of script can be integrated in CI/CD systems. Now you can do other things with your free time 🙂.
Story 2: Let’s print, but not build
Debugging by printing is one of the most widespread bug finding technique. It has its pros and cons, but one major disadvantage is rebuilding. Every time you add a new print you have to rebuild and when you debug an embedded application that runs on a remote appliance the whole process adds to the already hard task of debugging. Fortunately there is an alternative, dynamic printf. This gdb feature combines a breakpoint with formatted printing of the program’s data and the result is similar to a classic printf without recompiling phase implied the the last. Moreover, you can use it in rr because all gdb features are present in rr too. Let’s see it in action.
rr replay /home/user/.local/share/rr/sample_app-0
(rr) dprintf 20,"Seg fault is coming; the current random number is:%d\n", v[i].random # set a dynamic printf at line 20 and print the lanst random number generated
Dprintf 1 at 0x559d063552a6: file main.c, line 20.
(rr) c
Continuing.
id: 0 - random: 5
id: 1 - random: 13
Seg fault is coming; the current random number is:13
The syntax for dynamic printf is
dprintf location,template,expression[,expression…]
# location can be:
# - a line number
# - function name
# - instruction address
Also, the output of dynamic printf will occur prior to the instruction from location.
Story 3: Python superpowers
GDB has a python interpreter build-in. So you can control GDB by using python. A simple example:
(gdb) python
>print ('Hello world')
>end
Hello world # the command will be executed after the <end> command
And a more complex one:
(gdb) python import gdb
(gdb) python gdb.Breakpoint('18') # set a breakpoint
Breakpoint 1 at 0x1249: file main.c, line 18.
(gdb) python gdb.execute('start') #start
Temporary breakpoint 2 at 0x12c2: file main.c, line 25.

Temporary breakpoint 2, main () at main.c:25
25	int main() {
(gdb) python gdb.execute('c') #continue

Breakpoint 1, generate () at main.c:18
18	        printf("id: %d - random: %d\n", v[i].id, v[i].random);
This means that we can use python to script, automate and enhance GDB’s capabilities.
To highlight what I’m talking about let’s create a custom printer for the structure used by the sample application. As you can see below, the structure is very simple, but more complex ones can benefit from a custom printer.
typedef struct {
    int id;
    int random;
} tuple_t;
We can use the standard printer from GDB:
(gdb) print v[i]
$1 = {id = 0, random = 14}
Or we can use the pretty printer:
(gdb) set print pretty on
(gdb) print v[i]
$2 = {
  id = 0,
  random = 14
}
However, we can do more advanced operations by using python.
class bcolors:
    GREEN_BACKGROUND = '[6;30;42m'
    START_STYLE = '\x1b'
    END_STYLE = '\x1b[0m'

class MyCustomPrinter:
    def __init__(self, val):
        self.val = val

    def to_string(self):
        return (bcolors.START_STYLE + bcolors.GREEN_BACKGROUND+ \
                "\nid: %i\nrandom: %i" % (self.val['id'], self.val['random']) + \
                bcolors.END_STYLE)

    def display_hint(self):
        return 'tuple_t'

import gdb.printing
pp = gdb.printing.RegexpCollectionPrettyPrinter('tuple_t')
pp.add_printer('tuple_t', '^tuple_t$', MyCustomPrinter)
gdb.printing.register_pretty_printer(gdb.current_objfile(), pp)
In custom_printer.py I defined a custom printer for tuple_t structure. In MyCustomPrinter the printing format is described (to_string()). After that, the printer is added to the GDB printer collection. To use the custom printer we have to source the file. Use:
(gdb) source <filename>if GDB is already launchedgdb -x <filename>to tell GDB to execute commands from the file
(gdb) source custom_printer.py
(gdb) print v[i]
Output:
I’m not going in more detail about this subject in this article.
Story 4: Automate some breakpoint events
There is another nice feature that I want to mention. We can associate some commands with a breakpoint. This can be very handy when we want to log some messages and perform some actions when a breakpoint is hit, without our manual intervention. Here is an example:
rr replay /home/user/.local/share/rr/sample_app-0
(rr) break 18 # set a breakpoint
Breakpoint 1 at 0x559d06355249: file main.c, line 18.
(rr) command 1 # start a command for breakpoint number 1 (from line 18)
Type commands for breakpoint(s) 1, one per line.
End with a line saying just "end".
>silent # don't print the usual message when the execution stops at breakpoint
>print v[i] # print tuple_t structure
>continue # continue execution
>end # end the command
(rr) c
Continuing.
$1 = {id = 0, random = 5}
id: 0 - random: 5
$2 = {id = 1, random = 13}
id: 1 - random: 13

Program received signal SIGSEGV, Segmentation fault.
Story 5: Automate everything
And this is the last one. I mentioned that one of the advantages of rr is the ability to share the recording with other programmers. In this way, anyone implied in the debugging process has the same starting point that ensures that the bug can be reproduced at every run. Moreover, each programmer deals with the same non-deterministic factors. But what about the debugging progress? Can we share that too? Yes, we can! Let’s suppose that X found a possible code path that leads to the bug and wants to share this with Y. To be more specific, X wants to share the steps (breakpoints, gdb commands, etc.) that lead to his discovery. For this task, we can create a command file that can be used by GDB.
source custom_printer.py
dprintf 20,"Seg fault is coming; the current random number is:%d\n", v[i].random
break 18
command 2
silent
print v[i]
continue
end
In command.gdb I defined a set of actions that GDB will perform automatically. Firstly, it imports our custom printer. Secondly, it sets a dynamic printf breakpoint that will print a message before the segmentation fault signal arrives. After that, it sets a breakpoint at line 18 and defines a set of commands for it. And that’s all.
rr replay /home/user/.local/share/rr/sample_app-0
(rr) source command.gdb
Dprintf 1 at 0x559d063552a6: file main.c, line 20.
Breakpoint 2 at 0x559d06355249: file main.c, line 18.
(rr) c
Continuing.
$1 =
id: 0 # here we are using our custom printer
random: 5
id: 0 - random: 5
$2 =
id: 1
random: 13
id: 1 - random: 13
Seg fault is coming; the current random number is:13
Conclusion
Debugging is a complex subject. Sometimes we can spot the bug at a code glance, but other times we need days of sustained effort to find the root cause of the issue. In this article, I shared some tips and procedures that help me in my day-to-day debugging sessions and I hope that you will benefit from them too.
📩 Please feel free to share this article with colleagues and friends who will find it valuable.
References
I leave here some resources that helped me to enhance my debugging skills.
Reverse debugging:
- https://undo.io/resources/reverse-debugging-time-travel-debugging-brief-hist/#:~:text=“Reverse debugging is the ability,the logical way of debugging
- https://www.youtube.com/watch?v=5GeO92F-wfY
- https://github.com/rr-debugger/rr/wiki/Usage
- https://fitzgeraldnick.com/2015/11/02/back-to-the-futurre.html
Dynamic printf:
- https://doc.ecoscentric.com/gnutools/doc/gdb/Dynamic-Printf.html
- https://developers.redhat.com/articles/2021/10/05/printf-style-debugging-using-gdb-part-1#comparing_dprintf_and_printf__
GDB and Python:
GDB tips: